So you just got your first Blue Screen of Death (BSOD) or maybe your twentieth? Whatever the case, most people don’t know how to fix BSOD problems themselves. If you have someone geeky in your family, they might be able to fix it for you, but there are a lot of times when you have to send the “dump” files to a technical person so that they can determine the cause of the problem.
The dump files are simply the log files created when the BSOD occurs. It has all the info related to the error and can be analyzed to determine what caused the error to occur. In this post, I’m going to tell you about a few free programs that will grab the dump files for you and either view them or create a nicely organized folder that you can zip and post to a forum, email to your IT department or email to a friend, etc. You can always search for the files and try to analyze them yourself and I’ve also gone through a little bit of that below.
The BSOD app, which you can download via the link below, is basically a batch file that runs a bunch of commands and grabs all the data automatically and places into a folder on your computer.
Once you download the tool, copy it over to your Documents library in Windows 7 or Vista. Go ahead and run the EXE file and give it a few minutes to run. It could take up to 10 minutes to run depending on how many times your computer has gotten the BSOD.
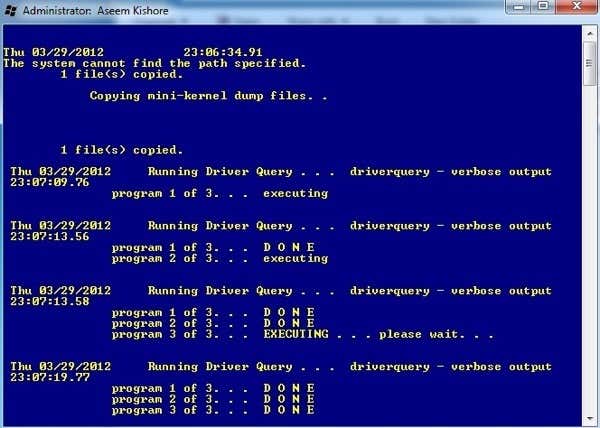
The program does all kinds of stuff that even I don’t really understand. If you scroll through the DOS window, though, you’ll see it collects information about drivers, the event log, program data, network data, the Windows registry, services, etc. It will create a folder in the same directory calledWindows7_Vista_jcgriff2, which contains all the outputted files.
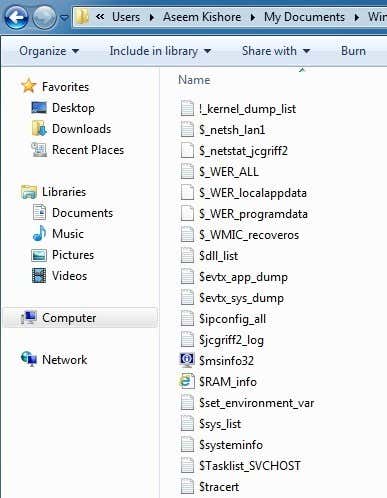
Now you can simply zip up the files and send them to the appropriate technical person who can help you analyze them. This particular program does not help you very much with viewing the dump files, but it does a great job of collecting loads of information about the crashes so that you can give it to someone else.
If you want to try and view the crash reports yourself, you can try out another nifty program called BlueScreenView.
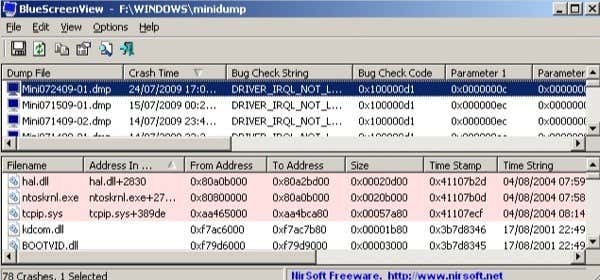
The program automatically scans all your minidump files, which are basically useful subsets of the crash dump file, and displays information about each crash in one table. Note that the first program mentioned looks at the entire dump file, but has a lot of extra information you may not need. This program scans just the minidump files, which Windows creates automatically and that are meant to be smaller with only crucial information so that it can be sent over the Internet more easily.
What’s cool about this program is that you can see the original blue crash screen that Windows displays and a whole bunch of other information including the time of the crash and the file name/description of each driver that may have caused the crash.
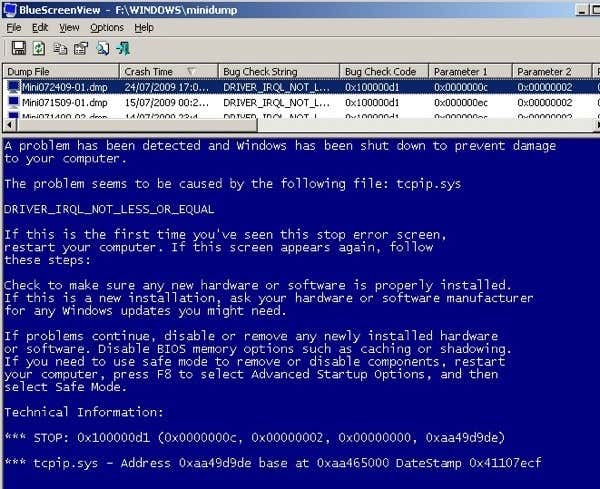
Overall, BlueScreenView is very good, but there are times when it will give you the incorrect driver as the cause of the problem. The reason for this is because it assumes the last driver to load before the crash is the cause and therefore it gives a lot more blame to Microsoft drivers than third-party drivers that are the real culprits.
If you really want to get your hands dirty without needing to become a technical guru, you can download the Debugging Tools for Windows.
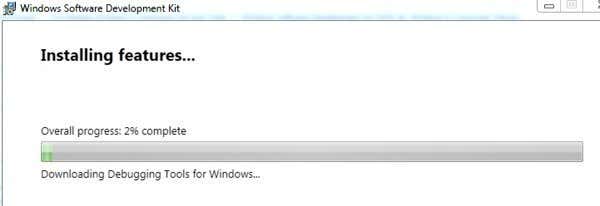
There are several different ways to install it, but you really only need the Debugging Tools as a Standalone Component, which you can download here:
When you go to install it, you will see a list of options with checkboxes. You only need to install the Windows Debugging Tools. Everything else can be unchecked.
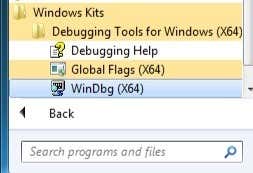
Once installed, you can go to All Programs and you’ll see a new folder called Windows Kits, which has the debugging tool inside.
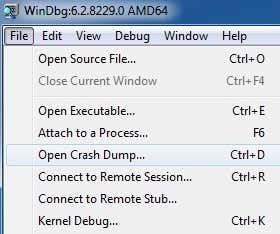
Simply run the program and click on File and Open Crash Dump.
Now all you have to do is search your computer for files ending in *.dmp or *.mdmp. You can find all the minidump files here:
%SystemRoot%\Minidump
You’ll have to change your system settings to be able to view hidden and system files, otherwise they won’t show up. Once the dump file is opened it will try to analyze it and tell you where the problem occurred. It’s a good idea to use BlueScreenView and WinDbg to analyze the dump file as they may give different answers.
This is definitely not a comprehensive guide to reading or analyzing dump files, but it hopefully gets you going in the right direction depending on what you want to do with the dump files. Enjoy!


